Hello qtcenter forum,
I'm currently working on my pre-study at the university and am required to program a logging tool, which has following significant specifications:
- being able to process logs in 20ms intervals (lower bar)
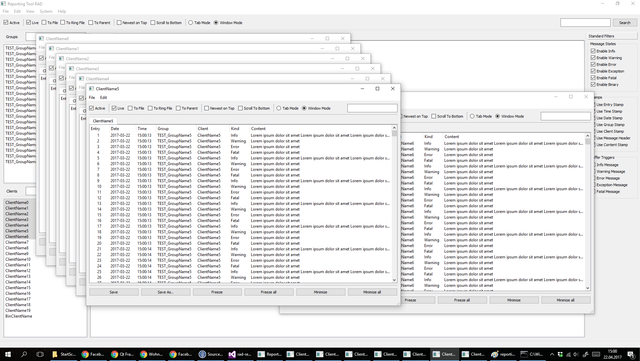
- being able to visually show up to 20 Clients logging in tabbed view
- being able to visually show up to 20 Clients in Floating Windows
Now, I've successfully covered the first two parts with Threads processing the logs and signaling the appropriate slots in the GUI Thread for adding the log entry to the appropriate table (QTreeView with Custom Table Model, inherited from QAbstractTableModel). This works fine for tabbed views, as only one tab is visible at all times, so the update of the view doesn't cause the GUI Thread to freeze.
But as soon as I have 20 Windows open, the GUI isn't responsive anymore.
The tool is a real-time logging tool, which usually is used on multi monitored system, where the windows are snapped next to one another and run 24/7. The logging application gathers logs from various other applications that use a logging library and send their logs over the network to a central computer, where the logging tool is running, where they are viewed and analysed. Eventhough I've been asked before why anyone would try to view 20 sepearte log windows at the same time, I can't deviate from this requirements, as it is, a requirement. Their old logging tool was able to handle it and I know from first hand experience with the old tool that it is indeed possible. But they used another ui framework for the old tool, so I can't just copy what they did. Also, I believe that framework supports drawing the UI elements from other threads, as the programmer of the old tool told me the windows are handled in just one thread. (Either that framework is pretty quick or the windows have internal threads running, redrawing themselves).
Following are relevant code segments of my application:
First off, the main window, which is a QMainWindow, this slot, handleProcessedLogs, is called per QueuedConnection from my CaptureThread, when a log or logs is/are readied.
void RT_Main::handleProcessedLogs(const QMap<QString, QList<QList<QString>>> rows) const
{
	QElapsedTimer timer;
	timer.start();
	for (auto it = rows.cbegin(); it != rows.cend(); ++it)
	{
		const RT_Client& client = modell.getConstClient(it.key());
		if (client.live())
		{
			client.addLog(it.value());
		}
		if (client.toParent())
		{
			const auto& groupClient = modell.getConstGroupClient(client.getGroupName());
			if (groupClient.live())
			{
				groupClient.addLog(it.value());
			}
			if (groupClient.toParent())
			{
				const auto& globalClient = modell.getConstClient(RT_Constants::GLOBAL);
				globalClient.addLog(it.value());
			}
		}
		if (client.toGlobal())
		{
			const auto& globalClient = modell.getConstClient(RT_Constants::GLOBAL);
			globalClient.addLog(it.value());
		}
	}
	qDebug() << "handleProcessedLogs: " << timer.nsecsElapsed() / 1000 << "micro seconds";
}
void RT_Main::handleProcessedLogs(const QMap<QString, QList<QList<QString>>> rows) const
{
QElapsedTimer timer;
timer.start();
for (auto it = rows.cbegin(); it != rows.cend(); ++it)
{
const RT_Client& client = modell.getConstClient(it.key());
if (client.live())
{
client.addLog(it.value());
}
if (client.toParent())
{
const auto& groupClient = modell.getConstGroupClient(client.getGroupName());
if (groupClient.live())
{
groupClient.addLog(it.value());
}
if (groupClient.toParent())
{
const auto& globalClient = modell.getConstClient(RT_Constants::GLOBAL);
globalClient.addLog(it.value());
}
}
if (client.toGlobal())
{
const auto& globalClient = modell.getConstClient(RT_Constants::GLOBAL);
globalClient.addLog(it.value());
}
}
qDebug() << "handleProcessedLogs: " << timer.nsecsElapsed() / 1000 << "micro seconds";
}
To copy to clipboard, switch view to plain text mode
The measurements show, with 20 clients visible and every 20ms 4 logs arriving yields a UI Time of 1-3 ms
The logs are prepared in a worker thread like this:
void RT_CaptureWorker::signalLogsReady()
{
if(!entries.isEmpty())
{
emit logsProcessed(entries);
entries.clear();
}
}
void RT_CaptureWorker
::handleLog(const QString clientName,
const QString groupName,
const REP
::PROTO::LogMsg & msg
) {
if (entries.contains(clientName))
{
entries[clientName].append(CommonLogUtils::prepareLogEntry(clientName, groupName, msg));
}
else
{
entries.insert(clientName, QList<QList<QString>>{CommonLogUtils::prepareLogEntry(clientName, groupName, msg)});
}
}
void RT_CaptureWorker::signalLogsReady()
{
	if(!entries.isEmpty())
	{
		emit logsProcessed(entries);
		entries.clear();
	}
}

void RT_CaptureWorker::handleLog(const QString clientName, const QString groupName, const REP::PROTO::LogMsg & msg)
{
	if (entries.contains(clientName))
	{
		entries[clientName].append(CommonLogUtils::prepareLogEntry(clientName, groupName, msg));
	}
	else
	{
		entries.insert(clientName, QList<QList<QString>>{CommonLogUtils::prepareLogEntry(clientName, groupName, msg)});
	}
}
To copy to clipboard, switch view to plain text mode
The CaptureWorker stores logs its readied in an internal container and when a signal to update arrives, signals the UI function mentioned above.
The UpdateWorker looks like this:
inline void RT_UpdateWorker::startUpdater()
{
while(true)
{
emit signalUpdate();
}
}
inline void RT_UpdateWorker::startUpdater()
{
	while(true)
	{
		emit signalUpdate();
		QThread::msleep(200);
	}
}
To copy to clipboard, switch view to plain text mode
Basically, it sends every 200ms a signal to update to the capture worker, which in turn, if it has something to update, signals the UI Thread handleProcessedLogs.
The Connections for the CaptureThread and UpdateWorker look like this (in the Constructor of the RApplication class):
{
worker = new RT_CaptureWorker();
worker->moveToThread(thread);
connect(this, &RApplication::logReceived, worker, &RT_CaptureWorker::handleLog, Qt::ConnectionType::QueuedConnection);
connect(this, &RApplication::binaryLogReceived, worker, &RT_CaptureWorker::handleBinaryLog, Qt::ConnectionType::QueuedConnection);
thread->start();
updateWorker = new RT_UpdateWorker();
updateWorker->moveToThread(updaterThread);
connect(this, &RApplication::startUpdater, updateWorker, &RT_UpdateWorker::startUpdater);
connect(updateWorker, &RT_UpdateWorker::signalUpdate, worker, &RT_CaptureWorker::signalLogsReady, Qt::ConnectionType::QueuedConnection);
updaterThread->start();
emit startUpdater();
m_timestamp = CL::monoClk().now();
}
{
		thread = new QThread();
		worker = new RT_CaptureWorker();
		worker->moveToThread(thread);
		connect(this, &RApplication::logReceived, worker, &RT_CaptureWorker::handleLog,  Qt::ConnectionType::QueuedConnection);
		connect(this, &RApplication::binaryLogReceived, worker, &RT_CaptureWorker::handleBinaryLog,  Qt::ConnectionType::QueuedConnection);
		thread->start();
		updaterThread = new QThread();
		updateWorker = new RT_UpdateWorker();
		updateWorker->moveToThread(updaterThread);
		connect(this, &RApplication::startUpdater, updateWorker, &RT_UpdateWorker::startUpdater);
		connect(updateWorker, &RT_UpdateWorker::signalUpdate, worker, &RT_CaptureWorker::signalLogsReady, Qt::ConnectionType::QueuedConnection);
		updaterThread->start();
		emit startUpdater();
		m_timestamp = CL::monoClk().now();
	}
To copy to clipboard, switch view to plain text mode
Also, my model performs bulk row updates, like this:
bool CustomTableModel::appendRow(const QList<QList<QString>> & rows)
{
if(listOfEntries.size() >= logHistoryLimit)
{
listOfEntries.removeFirst();
endRemoveRows();
}
beginInsertRows
(QModelIndex(), listOfEntries.
size(), listOfEntries.
size() + rows.
size());
for(const auto& row : rows)
{
listOfEntries.append(row);
}
endInsertRows();
return true;
}
bool CustomTableModel::appendRow(const QList<QList<QString>> & rows)
{
	if(listOfEntries.size() >= logHistoryLimit)
	{
		beginRemoveRows(QModelIndex(), 0, rows.size());
		listOfEntries.removeFirst();
		endRemoveRows();
	}
	beginInsertRows(QModelIndex(), listOfEntries.size(), listOfEntries.size() + rows.size());
	for(const auto& row : rows)
	{
		listOfEntries.append(row);
	}
	endInsertRows();
	return true;
}
To copy to clipboard, switch view to plain text mode
The performance is pretty good for tabs from my measurements with QElapsedTimer, as mentioned, at 20 clients, with logs arriving at 20ms intervalls, the UI Time (ie. the itme handleProcessedLogs CPU Time) fluctuates between 1 and 3 ms. This measurements stays the same with 20 Client windows open --> I also did the same measurement within the models appendRow, same results.
Now, with 20 Client windows open, I can - relatively speaking - comfortably switch between the Windows, access UI Elements etc., but when I move the window, the lag is still considerable,also when I try to scroll the QTreeView, it's lagging still. Sometimes the UI doesn't react for half a second, too. It's all "jumpy" right now.
I ran a profiling session with Visual Studio and it reports to me that the slowest path is within the Qt5GUI.dll and Qt5Widgets.dll. Thus, I arrived at the conclusion that the problem must be within the Qt Frameworks drawing engine.
The Question now is: How can I optimize View updates to solve this performance issue? Do I have to subclass paint() function to achieve that or is there a better solution? Would using QGraphicsView instead of QTreeView help in any way? Is there a way to write your custom QTreeView and bind beginInsertRows/endInsertRows to an internal event-loop, so I could move the whole window ops to seperate threads?
Any help is greatly appreciated!


 Reply With Quote
Bookmarks